- Log In
- Support
- Company
- Contact Us
- Live answers @ 1-888-532-4794
3 Valuable Answering Service Reports You Should Be Looking At
As an answering service company, we’re always looking for ways our users can get more value out of our service. You’re a busy small business and you need to make sure that whatever you buy makes financial sense. If you’re using a virtual receptionist service like Specialty Answering Service, or a CRM to organize customer data, the ability to furnish an ROI is critical. For Specialty Answering Service, the reports we offer in our portal are an important go-to for small businesses who want to make sure we’re performing at a high-level and costing as little as possible. But, there are so many reports available to you in your portal, it’s hard to know where to start.
Accessing a report is one thing, being able to interpret and turn the data into something actionable is something else. No worries though, that’s what we’re here for! The following are 3 reports available to you in your portal to start with where we believe you can use to get visibility into how your account is performing, and how to improve it.
1. Call Result
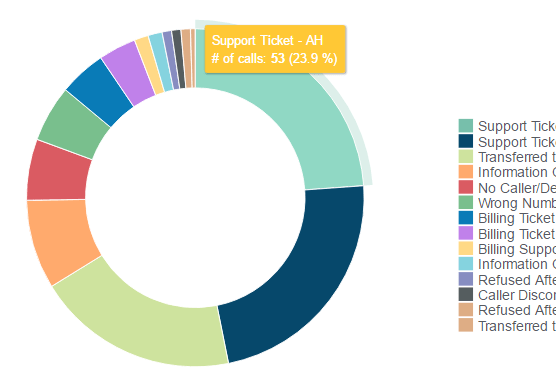
Call results offer a brief description of what each call is about, like Calling for Service or Requesting Refund, and our Call Result report helps consolidate all of that information into one simple place. If you’re trying to determine how many people called last week about refund requests, and how that compared to last month, we’ve got it covered. If you want to see how many urgent calls you get on average each month, we’ve got that covered, too.
Where can you find it
In your SAS Portal, you can find the Call Result report by going to the Reports tab on the left hand side of the screen. Once the page loads, a pie chart will show your report, which can be customized by campaign and/or a specific date range via the drop down menus on the left hand side of the screen.
How can you use this to improve your answering service
If you set up your answering service script with only one path, then all of your messages will have a “General Message” call result (aside from the wrong number calls that could trickle through). However, as any business owner knows, there are many different reasons why customers call. In order to make your life easier, we suggest creating a few different path options the operators can choose from. Each path would have it’s own call result, like Calling to Schedule or Needs Urgent Service, and you will no longer have to sift though dozens of calls just to find out what they were about.
2. Compare Usage from Last 3 Months
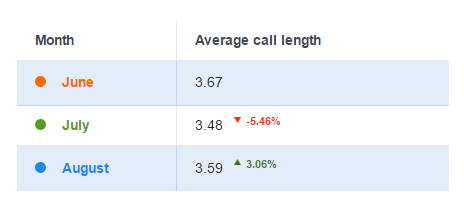
Our Compare Usage from Last 3 Months report provides great insight into how much you’re using the service. The messages you receive aren’t always an accurate depiction of your usage, as you won’t receive messages for wrong number calls or calls where the operators are able to answer customer questions. Since this report will give you the average length of calls for the last 3 months, you can use it to determine if your calls are taking too long. For example, if you see your calls are averaging at 5 minutes, you may want to remove some unnecessary elements in your script to get that number down.
Where can you find it
In your SAS Portal, you can find the Compare Usage from Last 3 Months report by going to the Reports tab on the left hand side of the screen. Once the page loads, scroll down to the bottom of the page where you’ll see a chart as well as a line graph illustrating the average call length (in minutes) from the last 3 months.
How can you use this to improve your answering service
By comparing your average usage for the last 3 months, you can identify trends and plan for the future accordingly. For example, if you notice spikes in volume on certain days of the week or certain times within a month, you can use that information to staff up accordingly in your own office. You may also want to use that information to update your answering service script. For example, if you’re getting a lot of calls during your billing period, it would be helpful to include some billing FAQs or a separate path in your script that operators can use to transfer calls to your in-house team.
3. Calls by Hour
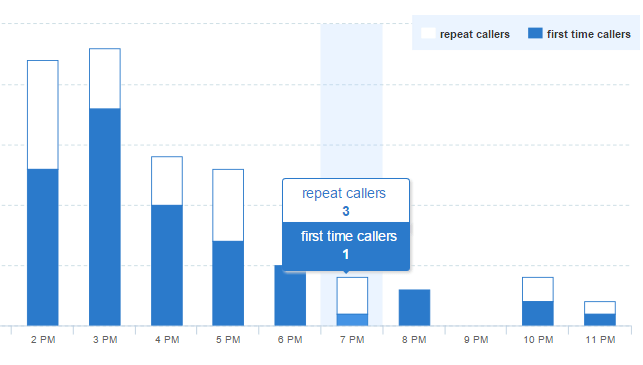
Looking at our Calls by Hour report is a great way to see just how much traffic you’re getting, broken down by the hour. On the report, you are able to see calls based off of who is a new caller and who is a repeat caller. The Calls by Hour report can also be broken down into business hours and after hours, which is helpful to see exactly when your business is receiving the most traffic, and if you need to make any adjustments accordingly.
Where can you find it
In your SAS Portal, you can find the Calls by Hour report by going to the Reports tab on the left hand side of the screen. Then, you’ll want to select the Call Traffic tab along the top of the screen. Once the page loads, a bar graph will show your report, which can be customized by campaign and/or a specific date range via the drop down menus on the left hand side of the screen.
How can you use this to improve your answering service
Viewing the Calls by Hour report can help you adjust your current protocols, whether they are in-house or with your answering service. For example, if you notice you’re getting a lot of repeat calls, perhaps you can have your answering service provide callers with alternative contact information where they can get in touch with your staff directly. Looking at the report to see the difference in traffic from business hours to after hours can also provide a lot of helpful insight. For example, if you’re receiving a lot of calls after hours, it’s possible that your customers are unfamiliar with your business hours, or maybe it would be a good idea to implement an after hours on-call system to assist with urgent issues.
With these reports as something you become accustomed to reviewing, you’re on your way to making sure the answering service is operating as efficiently as possible. Want to access these analytics yourself? Sign up for a free trial of our answering service and see all answering service reports we offer.
Categories
- Advice (32)
- Answering Service 101 (18)
- Best Practices (10)
- Call Center Jobs (6)
- Call Center Software (20)
- Comparison (2)
- Customer Service (30)
- Funny (31)
- Holidays (19)
- Industry Hacks (19)
- Infographics (53)
- International (1)
- Medical (8)
- News (12)
- Phone Etiquette (2)
- Phones (14)
- Pricing (8)
- Quizzes (3)
- Receptionist (11)
- SAS Products (29)
- Scripting (4)
- Services (5)
- Small Business (25)
- Starting Up (7)
- Tips and Tricks (19)
- Uncategorized (1)
- Videos (19)
- Workplace (6)
Recently writen
- Call Center Script Best Practices: Advanced Script Block Tips to Optimize Your Answering Service
- January 2025 Release Notes – Adjustments to Call Details Timeline, New Scripting Updates, Live Transcription, and more!
- April 2024 Release Notes – Voicemail Greetings, Ability to Access Websites With a Username and Password, and more!
- March 2024 Release Notes – New Add-On, Settings Revamp, and more!
Follow Us
How about a demo?
We'll show you how our web portal works and answer any questions you have about SAS.
Schedule a demo


